ECGs are one of the most commonly requested investigations during ward rounds or in an emergency on a day-to-day basis. Yet they remain one of the most feared among medical students and junior doctors.
Why? Because they look complicated with all the waves, spikes, and intervals, it can feel overwhelming to understand what it all indicates.
But don’t worry, you’ll gradually learn it with proper practice and structure. You don’t require superpowers to learn.
This guide is for medical students, clinical attaches, junior doctors, and IMGs who want to read an ECG without breaking into a cold sweat. We’ll go step-by-step with a mnemonic to help you remember.
What Is an ECG?
ECG stands for Electrocardiogram (also known as EKG or 12-lead ECG).
It’s a test that records the electrical activity of the heart. It tells us when the heart squeezes and pumps blood through its electrical signals.
The ECG creates a graph that shows the heart’s electrical activity over time.
1. ECG Placement – Put It Where It Belongs
Before that, don’t we have to know how many leads there are?
1
Limb Leads
- Lead I
- Lead II
- Lead III
- aVR
- aVL
- aVF
aVR, aVL, and aVF are augmented leads.
2
Precordial Leads
- V1
- V2
- V3
- V4
- V5
- V6
Have you ever wondered why it is called a 12-lead ECG, despite only having 10 leads to apply to the body?
The four leads you put on the limbs, and the six leads you put on the chest.
Here is the answer in simpler words:
Here we say 12 because it gives us 12 different views of the heart. The limbs lead to the ones we place on the limbs, providing six views.
Specifically, the three leads give us the frontal view of the heart, and the augmented leads give us an extra view from the inferior and lateral sides.
In contrast, the precordial leads give the horizontal view of the heart.
If you mix up the leads, you’ll end up diagnosing the ECG of a completely different heart.
Here is the ECG Lead Placement:

Limb leads
To place on the arms and legs.
Remember: “Ride Your Green Bike”
• Red → Right Arm (RA)
• Yellow → Left Arm (LA)
• Green → Left Leg (LL)
• Black → Right Leg (RL – the ground lead, doesn’t record heart activity)
Chest leads
• V1: 4th intercostal space, right of sternum
• V2: 4th intercostal space, left of sternum
• V3: Midway between V2 and V4
• V4: 5th intercostal space, midclavicular line
• V5: Same level as V4, anterior axillary line
• V6: Same level, midaxillary line
Tip: Place chest leads like you’re tracing the curve of the left ventricle around to the side.
2. ECG Paper – The Map of the ECG
Before reading the patterns or the waves, we should understand how it runs:
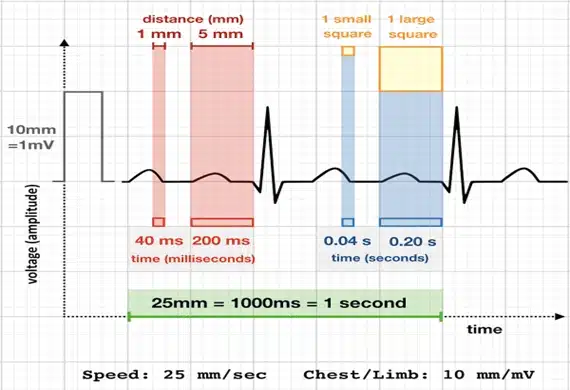
The paper output speed is how fast the ECG machine prints the heart’s electrical activity on paper.
Speed
In a standard ECG paper, the speed is 25 mm/second.
• 1 small square = 0.04 sec(40ms)
• 1 big square = 0.20 sec(200ms)
• 5 big squares = 1 second
Voltage
10 small squares = 1 mV.
When the electrical signals are given, voltages are seen as peaks in the ECG paper.
If no signals are produced, a flat line will appear, indicating the pause period of the heart activity.
To determine the time intervals, we count the small squares and multiply by 0.04 s, since each small horizontal square represents 0.04s.
Posts You Will Love
For example, to determine the PR interval, we first count the small boxes, which is 3, and then multiply it by 0.04s, resulting in 0.12s.
Likewise, measuring the vertical height of the waves, where each small box is 1mm, we count the small boxes and convert them into mV.
Hence, there will be 1500 small boxes or 300 large boxes. Squares will be calculated to be 1 minute.
That’s why you see a calibration box at the start of most ECGs.
3. The ECG Waves – What Does Each Mean?
Think of each part of the ECG as the heart’s conversation during a heartbeat:

- P wave → The Atria squeeze the blood into the ventricles (atrial depolarisation)
- PR segment → The signal is sent to the AV node before heading to the ventricles
- PR interval → Travel time from atria to ventricles (normal 0.12–0.20 sec)
- QRS complex → Ventricles squeezing (ventricular depolarisation), it usually should be < 0.12 sec
- ST segment → Pause before ventricles relax: a flat line
- T wave → The Ventricles are relaxing (ventricular repolarisation)
- QT interval → Squeeze + relax time for ventricles = start of QRS to end of T wave.
Tip: Prolonged QT can trigger dangerous rhythms, especially Torsades de Pointes, which can cause sudden cardiac arrest.
4. The 8-Step ECG Reading Checklist
Here is how you should be reading the ECG in a step-wise approach. This eliminates errors and gives you confidence.
How to Read an ECG in 8 Steps
Never jump straight to “oh no, I see a ST elevation” — always follow the order.
Step 1 – Check the basics
Is it the right patient? Right date? Right time? Make sure you write down the patient’s name, ID, age and sex.
Trust me — you don’t want to get this wrong when you’re presenting a case.
Step 2 – Spot the P wave
– It should be upright in Lead II
– It should come before every QRS, which tells us that the rhythm is sinus rhythm.
If it’s missing or flipped, then the heart’s starting signal may be coming from somewhere else.
Step 3 – Measure the PR interval
– Normal = 0.12–0.20 sec (3–5 small squares)
– Long → Think of first-degree AV block
– Short → Then think of pre-excitation (e.g., WPW) or junctional rhythm
Step 4 – Look at the QRS complex
– Normal width = < 0.12 sec
– Narrow QRS complexes (less than 100 ms) usually start above the ventricles.
– Wide QRS → meaning it takes longer than normal for the heart’s ventricles to squeeze (bundle branch block, ventricular rhythm)
Step 5 – Check the rhythm
Sinus Rhythm? Regular or irregular?
Mark two R waves on a piece of paper and slide it along; if the gaps match, it’s regular. If it doesn’t match the gaps, then it’s irregular.
So there are different types of rhythm, we can classify them as:
– Regular rhythm is characterised by evenly spaced beats, or R waves.
But in case of Irregular here, the beats or the R waves aren’t evenly spaced, but if you notice it follows a clear pattern or has an equal spacing.
– In Irregularly Irregular, the beats or R waves are so random, without any pattern or equal spacing.
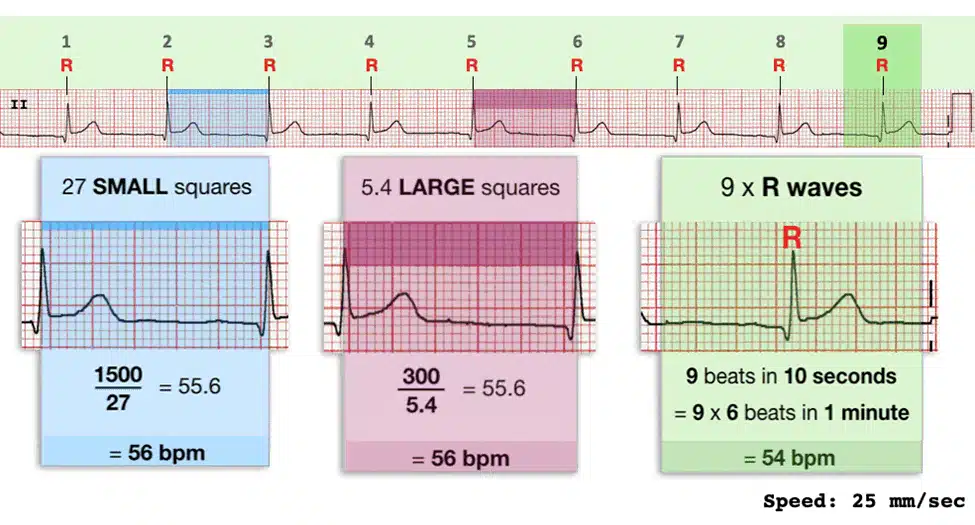
Step 6 – Calculate heart rate
ECG: How to Calculate Heart Rate Four quick ways:
Previously, we discussed the time interval: 300 large boxes or 1500 boxes in 1 minute. With these, we can easily calculate the heart rates.
For regular rhythm, we can use the large or small box method.
Nothing is there to memorise, make sure you understand it and use your convenient method for calculating the heart rate.
1. Large box method: 300 ÷ number of big boxes (regular rhythms)
2. Small box method: 1500 ÷ number of small boxes (fast rhythms)
3. 6-second method: QRS in 10 sec × 6 (suitable for irregular rhythms)
4. Sequence method: Remember 300-150-100-75-60-50 and count boxes between R waves. For this method, ensure you hear the sequence number to count the heart rate accurately.
Now that you know the heart rate, wouldn’t you want to see if it’s normal?
For that, remember these criteria to know where it belongs :
1. Normal: 60 – 100 bpm
2. Tachycardia: > 100 bpm. Think of it as your heart, like the rabbit in the race.
3. Bradycardia: < 50 bpm. Here, think of your heart as the turtle in the race.
Step 7- ECG Axis: Where is the heart located?
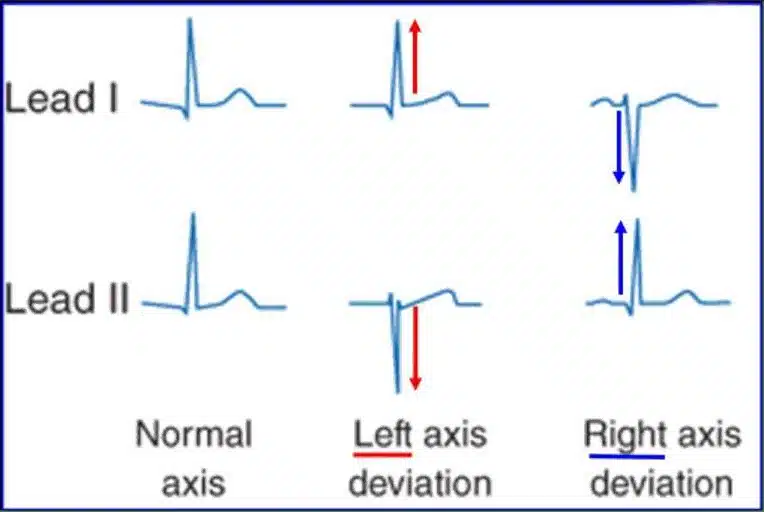
ECG Axis Deviation – Tell us the direction of the heart’s electrical activity.
– The normal axis of the point is down and to the left, which is between 0 degrees and + 90 degrees.
– For this, we need to look at the Lead 1 and Lead aVF to know the axis of the heart.
– If both are positive → Normal axis( Both the peaks are pointing upwards, meaning +ve)
– Lead I positive & aVF negative → Left axis deviation( Remember both the peaks are in opposite direction, so there is a way =Leaving =Left)
– Lead I negative & aVF positive → Right axis deviation (Here both the peaks are meeting each other = Reaching each other=Right)
– Both negative → Extreme axis deviation(Both the peaks are pointing downwards, meaning -ve)
Step 8– Put it together
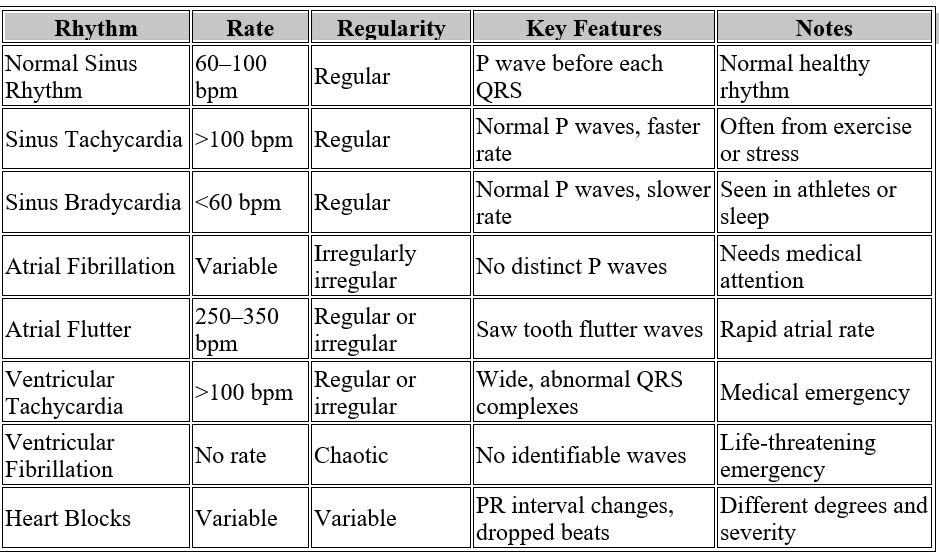
ECG Summary Table Once you’ve done the steps, label the rhythm.
Refer to the table below to understand the various rhythms produced under different conditions of heart abnormalities.
Result
Congratulations on learning to read the ECG in 8 steps. Carry this and you will not have any problems decoding even difficult ECGs.
In many acute scenarios, ECG interpretation goes hand-in-hand with ABG interpretation in acute care. It is a good idea to learn the basics of interpreting common investigations.
You will also love:
4. Common Abnormalities We Can Find in The ECG
When discussing ECG abnormalities, there are numerous types, with some being rare, which is good to know and keep in mind.
However, is it essential to understand the most common and basic abnormalities first?
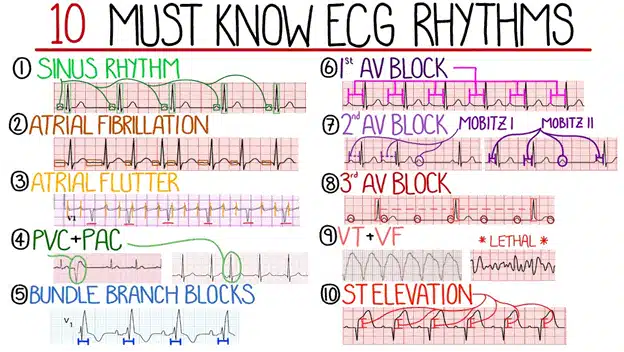
Here are a few key points to remember about common ECG abnormalities:
1. Atrial Fibrillation (AF)
What happens?
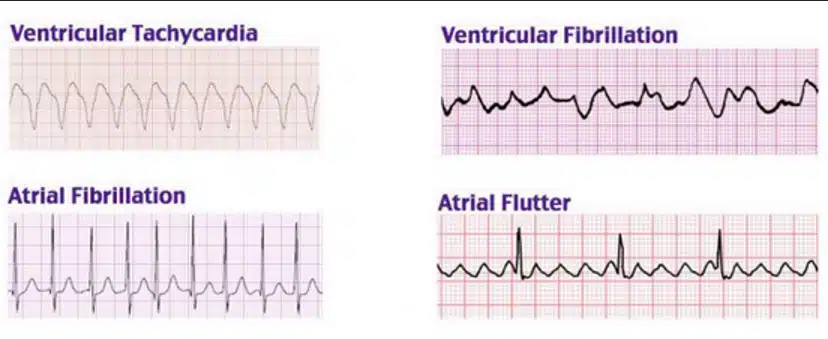
Here, the atria beat irregularly and randomly.
What do we see in an ECG?
- No distinct P waves, which we usually see
- Irregularly irregular rhythm, very random heartbeats.
- Variable R-R intervals, the distance between them is unpredictable.
Why it matters:
- AF can cause blood to pool and form clots in the atria, increasing stroke risk.
- It often causes palpitations or irregular heartbeats.
2. Atrial Flutter
What happens?
The atria beat very fast but in a regular pattern, like a “fluttering” pattern.
What do we see in an ECG?
- “Saw-tooth” pattern is the typical feature of atrial flutter, usually seen in leads II, III, and aVF.
- Regular atrial rhythm, often with a fixed ratio of atrial to ventricular beats (e.g., 2:1 block means 2 atrial flutters for every 1 ventricular beat)
Why it matters:
It can cause similar symptoms to AF and may also increase stroke risk.
3. Ventricular Tachycardia (VT)
What happens?
The ventricles beat very fast on their own, independent of the atria.
What do we see in an ECG?
- Wide QRS complexes (>120 ms), because the ventricles are firing abnormally
- Rapid heart rate (>100 bpm)
- No clear P waves preceding QRS complexes
Why it matters:
VT can be life-threatening, leading to poor heart pumping or sudden cardiac arrest.
4. Ventricular Fibrillation (VF)
What happens?
The ventricles quiver instead of contracting effectively, meaning no blood is pumped out — this is a cardiac arrest rhythm.
What do we see in an ECG?
- No identifiable P waves, QRS complexes, or T waves
- Completely chaotic, irregular waveforms of varying amplitude and frequency
- No organised electrical activity
Why it matters:
- VF is immediately life-threatening — it’s the most common rhythm in sudden cardiac arrest.
- Requires urgent defibrillation and CPR.
5. Premature Ventricular Contractions (PVCs)
What happens?
The ventricles fire early, causing a premature beat.
What do we see in an ECG?
- Early, wide, bizarre-looking QRS complexes
- No preceding P wave
- Followed by a compensatory pause (heartbeat skips a beat, then resumes)
Why it matters:
PVCs can be common and benign, but frequent PVCs may cause symptoms or signal heart disease.
6. Myocardial Infarction (Heart Attack)
What happens?
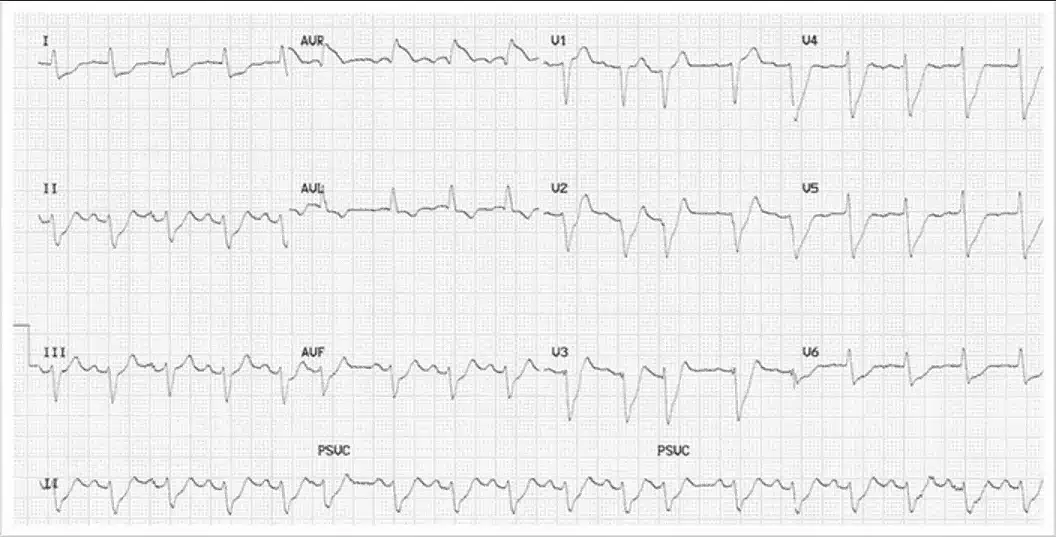
Blood flow to part of the heart is blocked, damaging the heart muscle.
What do we see in an ECG?
- ST Elevation MI (STEMI): The ST segment is raised above baseline in specific leads
- Non-ST Elevation MI (NSTEMI): ST segment depression or T wave inversion
- Pathological Q waves develop later, indicating dead tissue
Why it matters:
Recognising MI early on an ECG helps with immediate treatment to save the heart muscle.
7. Bundle Branch Blocks (BBB)
What happens?
One side of the heart’s electrical conduction system is blocked or delayed.
What do we see in an ECG?
- Right Bundle Branch Block (RBBB): Wide QRS, rsR’ pattern (“rabbit ears”) in V1 lead
- Left Bundle Branch Block (LBBB): Wide QRS, broad or notched R wave in V5-V6 leads
Why it matters:
BBB can indicate underlying heart disease or damage.
8. First-Degree Heart Block
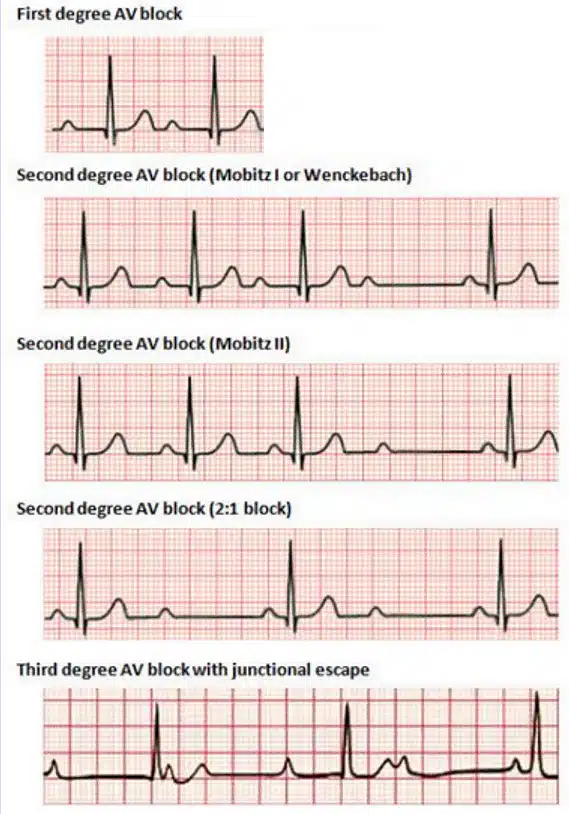
What happens?
Electrical signals from atria to ventricles are slowed, but all signals get through.
What do we see in an ECG?
- Prolonged PR interval (>200 ms)
- Each P wave is followed by a QRS complex (no missed beats)
Why it matters:
Usually benign, but can be a sign of conduction system disease.
9. Second-Degree Heart Block
Two types:
- Mobitz Type I (Wenckebach):
- PR interval gradually lengthens until one beat is missed (a dropped QRS)
- Usually benign.
- Mobitz Type II:
- PR intervals are constant, but occasional dropped QRS complexes without warning.
- This condition is more serious and may need a pacemaker.
10. Third-Degree (Complete) Heart Block
What happens?
No communication between the atria and the ventricles; they beat independently.
What do we see in an ECG?
- P waves and QRS complexes appear independently with no relation
- Ventricular rate is slow and regular, and atrial rate is faster and regular
Why it matters:
Life-threatening; usually requires a pacemaker immediately.
11. Hyperkalemia ECG Changes

What happens?
High potassium levels affect the heart’s electrical activity.
What do we see in an ECG?
- Peaked, tall, narrow T waves
- Flattened or absent P waves
- Widened QRS complexes
- Severe cases: sine wave pattern before cardiac arrest
Why it matters:
Hyperkalemia is a medical emergency needing urgent treatment.
ECG Essentials in a Nutshell
- Correct lead placement is the foundation: misplacement can lead to a different diagnosis. Always check limb and chest leads before interpreting.
- Use a systematic approach:
- Waveforms (P, QRS, T)
- Intervals (PR, QRS, QT)
- Rhythm
- Rate
- Axis
- ST-segment and T-wave changes
- Recognise the red-flag rhythms (immediate action needed):
- Ventricular fibrillation
- Pulseless ventricular tachycardia
- Complete heart block with instability
- STEMI with ongoing chest pain
- Common abnormalities are patterns, not single beats: confirm in multiple leads before concluding.
- Clinical context matters — an ECG is a tool, not the whole story. Always combine findings with history and examination.
- Practice is key — Knowing the normal ECG and reviewing more and more ECGs helps you spot abnormal ones faster.
You will gain more experience and confidence by completing the ALS course. This is definitely recommended if you are starting your on-calls.
Bottom line: Right placement, structured reading, and pattern recognition will make your ECG interpretation faster, safer, and more accurate.


